
XRP (XRP) cryptocurrency logo

XRP Price Today, Chart and Fiat Converter

Check the current XRP price in US dollars, explore its history and calculate the reference value of your balance in major fiat currencies. Compare the observation time with the amount you intend to exchange before relying on a displayed figure.

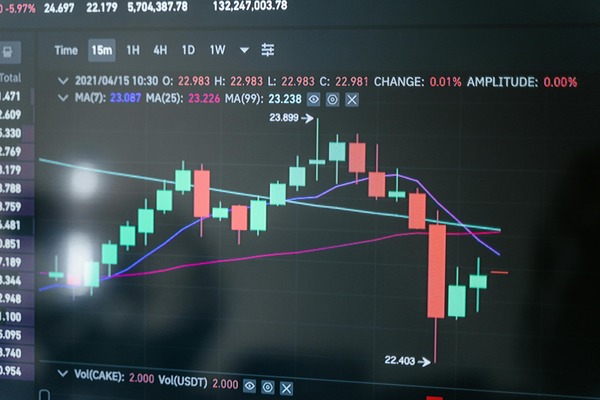
Candlestick price chart on a dark trading screen

XRP Price and Historical Chart

The chart shows the USD reference price, changes over the selected period and market context from the same data feed. Choose a shorter window for recent movement or the full available history to inspect earlier trading levels.

XRP (XRP) cryptocurrency logoXRP/USD price$1.3200
24h+3.06%7d+2.24%30d-12.31%
24H high $1.323424H low $1.2769
XRP/USD price, 24 hoursXRP price increased from $1.2814 on Nov 4, 2026 to $1.3192 on Nov 5, 2026.1.32341.31181.30011.28851.276910:0015:5421:4803:4309:37Nov 4, 2026 10:00 UTC — $1.2814Nov 4, 2026 11:00 UTC — $1.2898Nov 4, 2026 12:00 UTC — $1.2869Nov 4, 2026 13:00 UTC — $1.2769Nov 4, 2026 14:00 UTC — $1.2812Nov 4, 2026 15:00 UTC — $1.3140Nov 4, 2026 16:00 UTC — $1.3153Nov 4, 2026 17:00 UTC — $1.3140Nov 4, 2026 18:00 UTC — $1.3104Nov 4, 2026 19:00 UTC — $1.3054Nov 4, 2026 20:00 UTC — $1.2989Nov 4, 2026 21:00 UTC — $1.3033Nov 4, 2026 22:00 UTC — $1.3028Nov 4, 2026 23:00 UTC — $1.3108Nov 5, 2026 00:00 UTC — $1.3043Nov 5, 2026 01:00 UTC — $1.3026Nov 5, 2026 02:00 UTC — $1.3076Nov 5, 2026 03:00 UTC — $1.3057Nov 5, 2026 04:00 UTC — $1.3082Nov 5, 2026 05:00 UTC — $1.3077Nov 5, 2026 06:00 UTC — $1.3058Nov 5, 2026 07:00 UTC — $1.3094Nov 5, 2026 08:00 UTC — $1.3130Nov 5, 2026 09:00 UTC — $1.3234Nov 5, 2026 09:37 UTC — $1.3192

XRP price increased from $1.2814 on Nov 4, 2026 to $1.3192 on Nov 5, 2026.

7D high $1.32347D low $1.2076
XRP/USD price, 7 daysXRP price increased from $1.2910 on Oct 29, 2026 to $1.3192 on Nov 5, 2026.1.32341.29441.26551.23651.2076Oct 29Oct 31Nov 1Nov 3Nov 5Oct 29, 2026 10:00 UTC — $1.2910Oct 29, 2026 14:00 UTC — $1.2904Oct 29, 2026 18:00 UTC — $1.2922Oct 29, 2026 23:00 UTC — $1.2437Oct 30, 2026 03:00 UTC — $1.2181Oct 30, 2026 07:00 UTC — $1.2654Oct 30, 2026 11:00 UTC — $1.2573Oct 30, 2026 16:00 UTC — $1.2517Oct 30, 2026 20:00 UTC — $1.2486Oct 31, 2026 00:00 UTC — $1.2548Oct 31, 2026 04:00 UTC — $1.2494Oct 31, 2026 08:00 UTC — $1.2448Oct 31, 2026 13:00 UTC — $1.2483Oct 31, 2026 17:00 UTC — $1.2531Oct 31, 2026 21:00 UTC — $1.2498Nov 1, 2026 01:00 UTC — $1.2551Nov 1, 2026 06:00 UTC — $1.2544Nov 1, 2026 10:00 UTC — $1.2515Nov 1, 2026 14:00 UTC — $1.2522Nov 1, 2026 18:00 UTC — $1.2490Nov 1, 2026 23:00 UTC — $1.2456Nov 2, 2026 03:00 UTC — $1.2518Nov 2, 2026 07:00 UTC — $1.2498Nov 2, 2026 11:00 UTC — $1.2479Nov 2, 2026 15:00 UTC — $1.2516Nov 2, 2026 20:00 UTC — $1.2488Nov 3, 2026 00:00 UTC — $1.2488Nov 3, 2026 04:00 UTC — $1.2504Nov 3, 2026 08:00 UTC — $1.2520Nov 3, 2026 13:00 UTC — $1.2810Nov 3, 2026 17:00 UTC — $1.2788Nov 3, 2026 21:00 UTC — $1.2787Nov 4, 2026 01:00 UTC — $1.2602Nov 4, 2026 05:00 UTC — $1.2702Nov 4, 2026 10:00 UTC — $1.2814Nov 4, 2026 14:00 UTC — $1.2812Nov 4, 2026 18:00 UTC — $1.3104Nov 4, 2026 22:00 UTC — $1.3028Nov 5, 2026 03:00 UTC — $1.3057Nov 5, 2026 07:00 UTC — $1.3094

XRP price increased from $1.2910 on Oct 29, 2026 to $1.3192 on Nov 5, 2026.

30D high $1.522630D low $1.2076
XRP/USD price, 30 daysXRP price decreased from $1.5030 on Oct 6, 2026 to $1.3192 on Nov 5, 2026.1.52261.45081.37911.30741.2357Oct 6Oct 13Oct 21Oct 28Nov 5Oct 6, 2026 10:00 UTC — $1.5030Oct 7, 2026 04:00 UTC — $1.4653Oct 7, 2026 22:00 UTC — $1.4145Oct 8, 2026 16:00 UTC — $1.3475Oct 9, 2026 10:00 UTC — $1.3999Oct 10, 2026 05:00 UTC — $1.4064Oct 10, 2026 23:00 UTC — $1.4030Oct 11, 2026 17:00 UTC — $1.4207Oct 12, 2026 11:00 UTC — $1.4041Oct 13, 2026 05:00 UTC — $1.3674Oct 13, 2026 23:00 UTC — $1.3701Oct 14, 2026 17:00 UTC — $1.3362Oct 15, 2026 11:00 UTC — $1.3077Oct 16, 2026 05:00 UTC — $1.3343Oct 17, 2026 00:00 UTC — $1.3100Oct 17, 2026 18:00 UTC — $1.2920Oct 18, 2026 12:00 UTC — $1.2970Oct 19, 2026 06:00 UTC — $1.3120Oct 20, 2026 00:00 UTC — $1.3031Oct 20, 2026 18:00 UTC — $1.3288Oct 21, 2026 12:00 UTC — $1.3551Oct 22, 2026 06:00 UTC — $1.3434Oct 23, 2026 00:00 UTC — $1.3080Oct 23, 2026 19:00 UTC — $1.3081Oct 24, 2026 13:00 UTC — $1.2840Oct 25, 2026 07:00 UTC — $1.2941Oct 26, 2026 01:00 UTC — $1.2951Oct 26, 2026 19:00 UTC — $1.2922Oct 27, 2026 13:00 UTC — $1.3138Oct 28, 2026 07:00 UTC — $1.3247Oct 29, 2026 01:00 UTC — $1.3199Oct 29, 2026 20:00 UTC — $1.2816Oct 30, 2026 14:00 UTC — $1.2400Oct 31, 2026 08:00 UTC — $1.2448Nov 1, 2026 02:00 UTC — $1.2520Nov 1, 2026 20:00 UTC — $1.2455Nov 2, 2026 14:00 UTC — $1.2530Nov 3, 2026 08:00 UTC — $1.2520Nov 4, 2026 02:00 UTC — $1.2522Nov 4, 2026 20:00 UTC — $1.2989

XRP price decreased from $1.5030 on Oct 6, 2026 to $1.3192 on Nov 5, 2026.

90D high $1.662590D low $0.9899
XRP/USD price, 90 daysXRP price increased from $1.0350 on Aug 7, 2026 to $1.3192 on Nov 5, 2026.1.59401.44311.29211.14120.9903Aug 7Aug 29Sep 21Oct 13Nov 5Aug 7, 2026 10:00 UTC — $1.0350Aug 9, 2026 16:00 UTC — $1.0426Aug 11, 2026 23:00 UTC — $1.0203Aug 14, 2026 05:00 UTC — $1.0082Aug 16, 2026 11:00 UTC — $0.9994Aug 18, 2026 18:00 UTC — $0.9998Aug 21, 2026 00:00 UTC — $1.2682Aug 23, 2026 06:00 UTC — $1.4480Aug 25, 2026 13:00 UTC — $1.4742Aug 27, 2026 19:00 UTC — $1.4514Aug 30, 2026 01:00 UTC — $1.3956Sep 1, 2026 08:00 UTC — $1.3797Sep 3, 2026 14:00 UTC — $1.3913Sep 5, 2026 20:00 UTC — $1.4164Sep 8, 2026 03:00 UTC — $1.3921Sep 10, 2026 09:00 UTC — $1.3816Sep 12, 2026 15:00 UTC — $1.3698Sep 14, 2026 22:00 UTC — $1.4430Sep 17, 2026 04:00 UTC — $1.3017Sep 19, 2026 10:00 UTC — $1.4124Sep 21, 2026 17:00 UTC — $1.4895Sep 23, 2026 23:00 UTC — $1.5016Sep 26, 2026 05:00 UTC — $1.5566Sep 28, 2026 12:00 UTC — $1.4927Sep 30, 2026 18:00 UTC — $1.4995Oct 3, 2026 00:00 UTC — $1.4846Oct 5, 2026 07:00 UTC — $1.5180Oct 7, 2026 13:00 UTC — $1.4446Oct 9, 2026 20:00 UTC — $1.3844Oct 12, 2026 02:00 UTC — $1.4028Oct 14, 2026 08:00 UTC — $1.3720Oct 16, 2026 15:00 UTC — $1.3272Oct 18, 2026 21:00 UTC — $1.2625Oct 21, 2026 03:00 UTC — $1.3337Oct 23, 2026 10:00 UTC — $1.3178Oct 25, 2026 16:00 UTC — $1.2990Oct 27, 2026 22:00 UTC — $1.3241Oct 30, 2026 05:00 UTC — $1.2520Nov 1, 2026 11:00 UTC — $1.2556Nov 3, 2026 17:00 UTC — $1.2788

XRP price increased from $1.0350 on Aug 7, 2026 to $1.3192 on Nov 5, 2026.

1Y high $2.52581Y low $0.9927
XRP/USD price, 1 yearXRP price decreased from $2.3425 on Nov 6, 2025 to $1.3102 on Nov 5, 2026.2.52582.14401.76221.38040.9986Nov '25Feb '26May '26Aug '26Nov '26Nov 6, 2025 00:00 UTC — $2.3425Nov 15, 2025 00:00 UTC — $2.2436Nov 24, 2025 00:00 UTC — $2.0463Dec 4, 2025 00:00 UTC — $2.2005Dec 13, 2025 00:00 UTC — $2.0087Dec 22, 2025 00:00 UTC — $1.9218Dec 31, 2025 00:00 UTC — $1.8749Jan 9, 2026 00:00 UTC — $2.1257Jan 18, 2026 00:00 UTC — $2.0618Jan 28, 2026 00:00 UTC — $1.9256Feb 6, 2026 00:00 UTC — $1.2133Feb 15, 2026 00:00 UTC — $1.5207Feb 24, 2026 00:00 UTC — $1.3662Mar 5, 2026 00:00 UTC — $1.4358Mar 15, 2026 00:00 UTC — $1.4253Mar 24, 2026 00:00 UTC — $1.4376Apr 2, 2026 00:00 UTC — $1.3484Apr 11, 2026 00:00 UTC — $1.3561Apr 20, 2026 00:00 UTC — $1.3957Apr 29, 2026 00:00 UTC — $1.3830May 9, 2026 00:00 UTC — $1.4206May 18, 2026 00:00 UTC — $1.4008May 27, 2026 00:00 UTC — $1.3266Jun 5, 2026 00:00 UTC — $1.1677Jun 14, 2026 00:00 UTC — $1.1502Jun 24, 2026 00:00 UTC — $1.1091Jul 3, 2026 00:00 UTC — $1.0869Jul 12, 2026 00:00 UTC — $1.0962Jul 21, 2026 00:00 UTC — $1.1112Jul 30, 2026 00:00 UTC — $1.0726Aug 8, 2026 00:00 UTC — $1.0206Aug 18, 2026 00:00 UTC — $1.0024Aug 27, 2026 00:00 UTC — $1.4225Sep 5, 2026 00:00 UTC — $1.3987Sep 14, 2026 00:00 UTC — $1.3416Sep 23, 2026 00:00 UTC — $1.5713Oct 3, 2026 00:00 UTC — $1.4846Oct 12, 2026 00:00 UTC — $1.4090Oct 21, 2026 00:00 UTC — $1.3343Oct 30, 2026 00:00 UTC — $1.2357

XRP price decreased from $2.3425 on Nov 6, 2025 to $1.3102 on Nov 5, 2026.

All high $3.2265All low $0.1591
XRP/USD price, all available historyXRP price increased from $0.3222 on May 9, 2017 to $1.3180 on Nov 3, 2026.3.22652.46691.70730.94770.188120172019202220242026May 9, 2017 00:00 UTC — $0.3222Aug 7, 2017 00:00 UTC — $0.1967Nov 5, 2017 00:00 UTC — $0.2300Jan 19, 2018 00:00 UTC — $0.8900Apr 19, 2018 00:00 UTC — $0.8734Jul 18, 2018 00:00 UTC — $0.4460Oct 16, 2018 00:00 UTC — $0.4436Jan 14, 2019 00:00 UTC — $0.2926Mar 30, 2019 00:00 UTC — $0.3261Jun 28, 2019 00:00 UTC — $0.3448Sep 26, 2019 00:00 UTC — $0.2711Dec 25, 2019 00:00 UTC — $0.2074Mar 24, 2020 00:00 UTC — $0.1929Jun 22, 2020 00:00 UTC — $0.1887Sep 5, 2020 00:00 UTC — $0.2512Dec 4, 2020 00:00 UTC — $0.5847Mar 4, 2021 00:00 UTC — $0.4690Jun 2, 2021 00:00 UTC — $0.8319Aug 31, 2021 00:00 UTC — $1.0968Nov 14, 2021 00:00 UTC — $0.9697Feb 12, 2022 00:00 UTC — $0.7511May 13, 2022 00:00 UTC — $0.3807Aug 11, 2022 00:00 UTC — $0.3491Nov 9, 2022 00:00 UTC — $0.3816Jan 23, 2023 00:00 UTC — $0.3922Apr 23, 2023 00:00 UTC — $0.4493Jul 22, 2023 00:00 UTC — $0.6282Oct 20, 2023 00:00 UTC — $0.6127Jan 18, 2024 00:00 UTC — $0.5058Apr 17, 2024 00:00 UTC — $0.5167Jul 1, 2024 00:00 UTC — $0.5372Sep 29, 2024 00:00 UTC — $0.5316Dec 28, 2024 00:00 UTC — $2.5758Mar 28, 2025 00:00 UTC — $2.0228Jun 26, 2025 00:00 UTC — $2.5465Sep 9, 2025 00:00 UTC — $2.8250Dec 8, 2025 00:00 UTC — $1.9033Mar 8, 2026 00:00 UTC — $1.3847Jun 6, 2026 00:00 UTC — $1.1489Sep 4, 2026 00:00 UTC — $1.3961

XRP price increased from $0.3222 on May 9, 2017 to $1.3180 on Nov 3, 2026.

Market cap$83.55B
24h volume$2.00B
Circulating supply63.35B XRP
All-time high$3.6500Jul 17, 2025
All-time low$0.002686May 21, 2014
Chart history startsMay 9, 2017

Updated: Nov 5, 2026 09:39 UTC · Sources: CoinGecko, Kraken (full history)

Historical highs and lows refer to the provider's recorded markets and coverage. The earliest observation is not necessarily the first price at which anyone acquired the asset, and a different data feed can report a different extreme.

Convert XRP into Major Fiat Currencies

Enter a balance to see its reference value in USD, EUR, GBP, CAD, AUD, JPY, INR, BRL or UAH. This is a valuation tool; it does not create a bank withdrawal or include the costs of a particular trade.

$1.3100

Reference rate: 1 XRP = $1.3100 · Updated: Nov 5, 2026 07:12 UTC

The currency table makes it easier to compare the value of one coin across the supported fiat denominations. Read each row's currency label and update time rather than comparing the raw numbers as if they used the same unit.

Currency1 XRP price24h changeUpdated
USD$1.3100+3.06%07:12 UTC
EUR€1.1600+2.73%07:12 UTC
GBP£0.9719+2.78%07:12 UTC
CADC$1.8300+2.89%07:12 UTC
AUDA$1.8700+2.55%07:12 UTC
JPY¥207.16+2.94%07:12 UTC
INR₹123.77+2.61%07:12 UTC
BRLR$7.1600+2.52%07:12 UTC
UAH₴59.7200+3.33%07:12 UTC

To estimate how many coins $100 or $1,000 represents, divide that dollar amount by the USD reference price. For the value of an existing holding, multiply its coin quantity by the price in the currency you want.

What the Market Figures Measure

A quote becomes more informative when you know which quantity it describes. Unit price, market capitalization and traded volume should not be treated as interchangeable measures of demand.

Trading desk with several monitors showing market data

Unit Price and Market Capitalization

Market capitalization is the reference price multiplied by circulating supply under the provider's definition. A lower coin price than Bitcoin's does not by itself imply a cheaper valuation, because the number of units differs.

Nor does a change in calculated capitalization measure the cash that entered the market. The XRP supply and escrow explanation covers the supply categories behind that calculation.

Trading Volume and Period Changes

Reported volume describes activity over a stated window and the markets covered by the feed. It does not show how much you could personally trade at the headline price without affecting execution.

A percentage change also needs a comparison period. A positive seven-day change can coexist with a negative daily move, so choose the interval that matches the question you are asking.

Read Price History in Context

Historical data can show how the asset traded, but it cannot establish when a prior high will be reached again. The chosen window also changes what a large or small movement looks like.

When comparing two points, check the currency, date and coverage. A change measured in euros combines the coin's movement with the exchange-rate relationship to the dollar feed or underlying markets.

For future assumptions rather than observed history, use the XRP price scenarios for upcoming horizons. Keep those conditional calculations separate from today's recorded price.

Laptop with a price chart in front of a city skyline at night

Move from Reference Value to an Exchange Quote

The market display helps value a balance; the exchange quote establishes the result for your chosen direction and amount. Available liquidity, the rate mode and included costs can make that result differ from a simple reference-price multiplication.

  • To turn an XRP balance into a stablecoin, review the XRP to USDT exchange and choose its receiving network.
  • To move the other way, buy XRP with USDT using the network where your tokens are held.

The sending wallet or platform can also charge for transferring funds. The guide to XRP fees and wallet reserves explains why that source cost differs from the amount retained in a personal ledger account.

Trader analysing a crypto chart on a large monitor

FAQ

Why can two providers display different XRP prices?

They can use different exchanges, aggregation methods and observation times. Compare their timestamps and currency labels before interpreting a small difference as a trading opportunity.

Can I use the displayed price after its update time has become stale?

Treat an old observation as historical information rather than an executable price. Refresh the market view and request a new exchange quote before committing funds.

Does the fiat table mean SwapXRP sends money to my bank?

No. The table values cryptocurrency in fiat units, while the exchange service converts between the supported crypto assets.